Clinical Dashboard

Transforming Documentation into Actionable Insights

Illustrative Dashboard
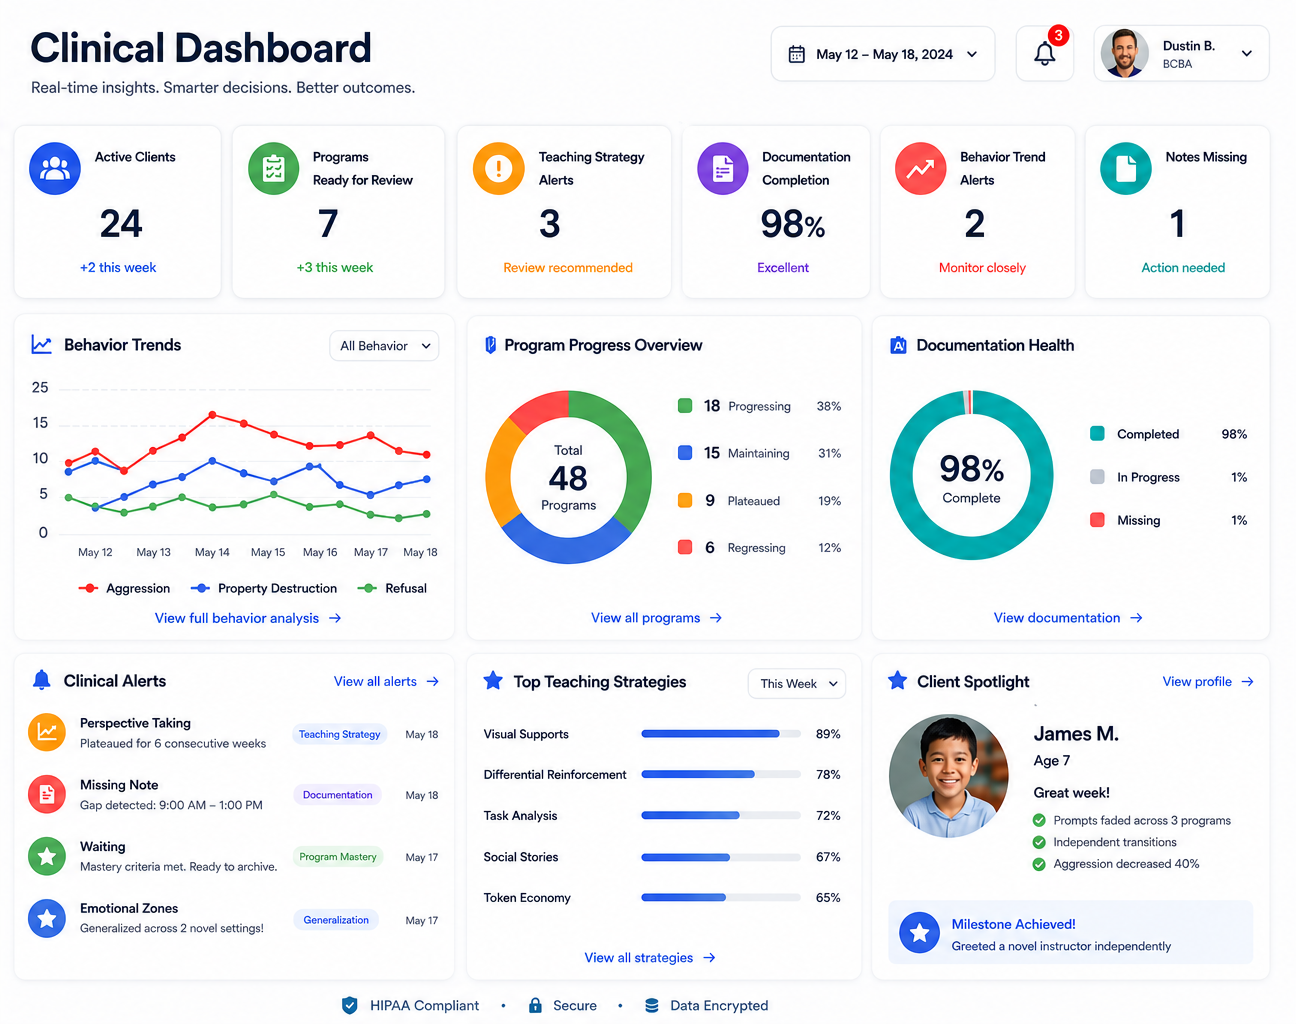
A digital clinical dashboard displaying various metrics and data visualizations. It includes panels for active clients, programs ready for review, alerted teaching strategies, documentation completion, behavior trends with a line chart, program progress overview with a pie chart, documentation health, clinical alerts, top teaching strategies with bar charts, client spotlight featuring a young boy, and milestone achievement.

What the Dashboard Provides

Instead of reviewing hundreds of individual notes, FIRST/then transforms documentation into actionable clinical insights.


Clinical Metrics

FIRST/then transforms session data into meaningful clinical trends, helping clinicians identify progress, plateaus, and opportunities for intervention.

  • Behavior Trends

  • Prompt Fading

  • Recovery Time

  • Generalization

  • Independence

  • Program Progress

  • Milestone Tracking

A woman with dark wavy hair looking down, sitting on a bench with a notebook and pen, against a wooden slat wall. Sunlight casts shadows on the white wall behind her, and a framed piece of art leans against the wall.

Leadership Metrics

Provide supervisors and leadership with organization-wide insights that support clinical quality, staff development, and operational efficiency.

  • Teaching Strategy Alerts

  • Program Plateau Detection

  • Archive Recommendations

  • Documentation Completion by Staff

  • Clinical Trend Monitoring

  • Staff Training Opportunities

Documentation Metrics

Improve documentation quality and reduce administrative burden through automated validation and compliance monitoring.

  • Documentation Completion

  • Missing Note Detection

  • Insurance Readiness

  • Required Field Validation

  • Documentation Quality Score

  • Restricted Terminology Detection

Contextual Intelligence

Clinical progress doesn't happen in isolation. First/Then allows contextual events to be visualized alongside behavioral and treatment data.

Examples include:

  • Medication changes

  • Illness or pain

  • Poor sleep

  • Schedule changes

  • Novel instructors

  • Extended absences

  • Staffing changes

A young boy with red hair, sitting at a yellow table, engaging in an educational activity involving alphabet cards and clothespins, in a bright, minimalist room.


A woman with short blonde hair wearing an orange sleeveless top and beige pants, sitting on an upholstered bench, and reading a book. There is a large green plant to her left and a wooden slat wall behind her. Sunlight creates a shadow pattern on the plain wall to her right.
A young woman with curly brown hair sitting at a desk, wearing a dark navy shirt, looking at papers, with a computer monitor nearby, in an office setting.

Every graph, alert, and recommendation begins with a single structured progress note.